 NERC Data Catalogue Service
Three dimensional models
Type of resources
Topics
Keywords
Contact for the resource
Provided by
Years
Formats
Representation types
Update frequencies
-
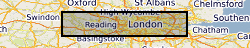
The BGS GeoSure Shrink Swell 3D data is a regional hazard susceptibility map that identifies areas of potential shrink–swell hazard, in three dimensional space, at intervals down to 20m in the London and Thames Valley area. Shrinking and swelling clays can change volume due to variation in moisture, which can cause ground movement that may affect many foundations. The data provides an indication of variation in Volume Change Potential (VCP) of shrink-swell clays and is classified on an A-E (low to high) range of hazard susceptibility. BGS GeoSure Shrink Swell 3D for London is part of the BGS GeoSure range of natural subsidence products. It is derived from the BGS Geology 50k data, the BGS London Lithoframe 3D model and the GeoSure v7 Shrink-Swell layer.
-
The folders GMPKU2311, GMPKU3089, ELISN108-343 and ELISN31-5 contain data from X-ray tomographic analyses of fossil embryos and post-embryonic stages as described: There is one data folder provided for each specimen, each containing the following: - Raw data: zip archive containing the raw scan data (.tif image stack). - Working files: zip archive containing the segmented slices (.tif image stack exported from Avizo labels). - Avizo project: the Avizo .hx project file. - Avizo labels: the Avizo .am labels file, containing the segmentation information. - 3D model: the 3D surface computed from the segmented labels data (.stl file). In the case of GMPKU2311 only the raw data and 3D model file are provided, as the surface was computed directly from an isosurface of the specimen in Avizo. The individual slices (.tif images) can be viewed with standard graphics software, and the datasets can be studied in 3D using tomographic reconstruction software such as Avizo (www.vsg3d.com/), Spiers (www.spiers-software.org/), VG Studio Max (www.volumegraphics.com) etc. The Avizo project and label files (.hx and .am files) require Avizo software (www.vsg3d.com/) to be opened. The 3D models (.stl files) are widely compatible with 3D freeware packages such as MeshLab (http://meshlab.sourceforge.net/) or Blender (https://www.blender.org/), or with proprietary software, e.g. Avizo (www.vsg3d.com/), Geomagic (http://www.geomagic.com/en/), Mimics (http://biomedical.materialise.com/mimics). The files relate to the following publication: Dong, X.; Vargas, K.; Cunningham, J. A.; Zhang, H.; Liu, T.; Chen, F.; Liu, J.; Bengtson, S. & Donoghue, P. C. J. 2015. Developmental biology of the early Cambrian cnidarian Olivooides. Journal of Paleontology.
-

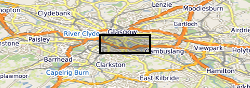
The UK Geoenergy Observatories (UKGEOS) Glasgow 3D coal mine model outputs, created by the British Geological Survey, provide a semi-regional overview of the depth and extent of surveyed and probable coal mine workings, plus stone and coal roads surveyed within the mines. The model allows users to visualise the surveyed and probable coal mine workings to be found beneath this part of Glasgow, applicable at a scale of around 1: 25,000 to 1: 10,000. The data is supplied as grids, triangulated surfaces over a 5 by 4.15 km area, with the depth range to around 300 m below Ordnance Datum. The mine extents are ‘cut out’ of the UKGEOS Glasgow post-drill bedrock model. This model describes both surveyed (recorded on mine abandonment plan) and probable coal mine workings. An area of probable workings has been updated to account for the results of drilling borehole GGC01. Further details and model limitations can be found in the accompanying metadata report http://nora.nerc.ac.uk/id/eprint/531157/
-
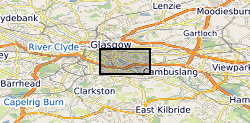
The UK Geoenergy Observatories (UKGEOS) Glasgow superficial deposits GSI3D model outputs, created by the British Geological Survey, provide a semi-regional overview of the depth, thickness and extent of glacial and post-glacial lithostratigraphic units above rockhead. The model allows users to visualise the likely subsurface sequence to be found beneath this part of Glasgow, applicable at a scale of around 1: 25,000 to 1: 10,000. The data is supplied as grids and shapefiles over a 7 by 4.15 km area, with the depth range to around 40 m below Ordnance Datum. This model describes an interpretation of the shallow geology updated to incorporate the results of drilling the 12 UKGEOS Glasgow boreholes (post-drill model). Further details and model limitations can be found in the accompanying metadata report http://nora.nerc.ac.uk/id/eprint/531155/ . DOI: https://doi.org/10.5285/915f690f-32cf-41b7-984e-c32344d3a543
-
The UK Geoenergy Observatories (UKGEOS) Glasgow 3D coal mine model outputs, created by the British Geological Survey, provide a semi-regional overview of the depth and extent of surveyed and probable coal mine workings, plus stone and coal roads surveyed within the mines. The model allows users to visualise the surveyed and probable coal mine workings to be found beneath this part of Glasgow, applicable at a scale of around 1: 25,000 to 1: 10,000. The data is supplied as grids, triangulated surfaces over a 5 by 4.15 km area, with the depth range to around 300 m below Ordnance Datum. The mine extents are ‘cut out’ of the UKGEOS Glasgow pre-drill bedrock model. This model describes both surveyed (recorded on mine abandonment plan) and probable coal mine workings before the UKGEOS Glasgow boreholes have been drilled, and was used to inform the expected sequence on drilling. Further details and model limitations can be found in the accompanying metadata report http://nora.nerc.ac.uk/id/eprint/522737
-
The UK Geoenergy Observatories (UKGEOS) Glasgow bedrock model outputs, created by the British Geological Survey, provide a semi-regional overview of the depth and extent of bedrock lithostratigraphic units, coals and faults. The model allows users to visualise the likely subsurface sequence to be found beneath this part of Glasgow, applicable at a scale of around 1: 25,000 to 1: 10,000. The data is supplied as grids, triangulated surfaces and shapefiles over a 5 by 4.15 km area, with the depth range to around 350 m below Ordnance Datum. This model describes an interpretation of the bedrock geology after the UKGEOS Glasgow boreholes had been drilled, the results of the nine UKGEOS boreholes that penetrated bedrock have been incorporated. Further details and model limitations can be found in the accompanying metadata report http://nora.nerc.ac.uk/id/eprint/531157/
-

The UK Geoenergy Observatories (UKGEOS) Glasgow superficial deposits GSI3D model outputs, created by the British Geological Survey, provide a semi-regional overview of the depth, thickness and extent of glacial and post-glacial lithostratigraphic units above rockhead. The model allows users to visualise the likely subsurface sequence to be found beneath this part of Glasgow, applicable at a scale of around 1: 25,000 to 1: 10,000. The data is supplied as grids and shapefiles over a 7 by 4.15 km area, with the depth range to around 40 m below Ordnance Datum. This model describes an interpretation of the shallow geology before the UKGEOS Glasgow boreholes have been drilled, and was used to inform the expected sequence on drilling. Further details and model limitations can be found in the accompanying metadata report http://nora.nerc.ac.uk/id/eprint/524556
-

The UK Geoenergy Observatories (UKGEOS) Glasgow bedrock model outputs, created by the British Geological Survey, provide a semi-regional overview of the depth and extent of bedrock lithostratigraphic units, coals and faults. The model allows users to visualise the likely subsurface sequence to be found beneath this part of Glasgow, applicable at a scale of around 1: 25,000 to 1: 10,000. The data is supplied as grids, triangulated surfaces and shapefiles over a 5 by 4.15 km area, with the depth range to around 350 m below Ordnance Datum. This model describes an interpretation of the bedrock geology before the UKGEOS Glasgow boreholes have been drilled, and was used to inform the expected sequence on drilling. Further details and model limitations can be found in the accompanying metadata report http://nora.nerc.ac.uk/id/eprint/522737.
-

This work presents a detailed three-dimensional finite element based model for wave propagation, combined with a postprocessing procedure to determine the fracture intensity caused by blasting. The data generated during this project includes output files of all simulations with detailed fields, geometries and meshes. The model incorporates the Johnson-Holmquist-2 constitutive model, which is designed for brittle materials undergoing high strain rates and high pressures and fracturing, and a tensile failure model. Material heterogeneity is introduced into the model through variation of the material properties at the element level, ensuring jumps in strain. The algorithm for the combined Johnson-Holmquist-2 and tensile failure model is presented and is demonstrated to be energy-conserving, with an open-source MATLABTM implementation of the model. A range of sub-scale numerical experiments are performed to validate the modelling and postprocessing procedures, and a range of materials, explosive waves and geometries are considered to demonstrate the model's predictive capability quantitatively and qualitatively for fracture intensity. Fracture intensities on 2D planes and 3D volumes are presented. The mesh dependence of the method is explored, demonstrating that mesh density changes maintain similar results and improve with increasing mesh quality. Damage patterns in simulations are self-organising, forming thin, planar, fracture-like structures that closely match the observed fractures in the experiments. The presented model is an advancement in realism for continuum modelling of blasts as it enables fully three-dimensional wave interaction, handles damage due to both compression and tension, and relies only on measurable material properties. The uploaded data are the specific simulation outputs for four explosion models occurring on two different rock types, and the specific fracture patterns generated.